Learn How To:
- Cite this website
- Interact with and navigate the charts and graphs on this website.
Citing information from this website
If you are citing data from one of the dashboards on this website (for example, a percentage, rate, or count), please provide the source listed within the Data Notes tab of the dashboard.
If you are citing analysis or indicator narrative from this website, please use the following citation:
- Whatcom County Health and Community Services. (Date Published). Webpage Name. Whatcom Community Health Insights. whatcomcommunityinsights.org
- Example: Whatcom County Health and Community Services (2024). Housing Security. Whatcom Community Health Insights. whatcomcommunityinsights.org
Population Health Indicator Overview
Why this is important: Brief information on why this indicator is important to public health.
Definition: Definition of the indicator.
Trend: What the data is showing us over time in Whatcom County.

Whatcom trend is increasing

Whatcom trend is decreasing

Whatcom trend is staying the same
Geography: How Whatcom County compares to Washington State.

Whatcom County is higher than WA state in the most recent year which data is available

Whatcom County is lower than WA state in the most recent year which data is available

Whatcom County is the same as WA state in the most recent year which data is available

Data for the indicator does not allow for comparisons with WA state
Disparities: Any disparities among different demographic groups that can be identified with available data.

There is a disparity among subpopulations

No disparities found among subpopulations

Data for this indicator did not allow for analysis for subpopulations
Dashboard Overview
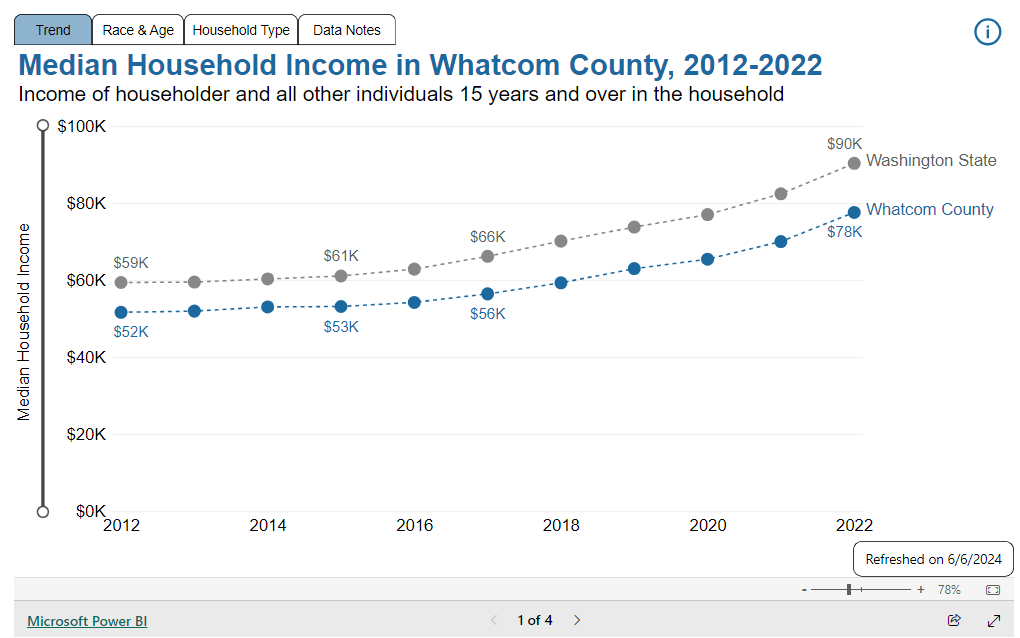
Each indicator has a dashboard that displays data in chart and graph form.
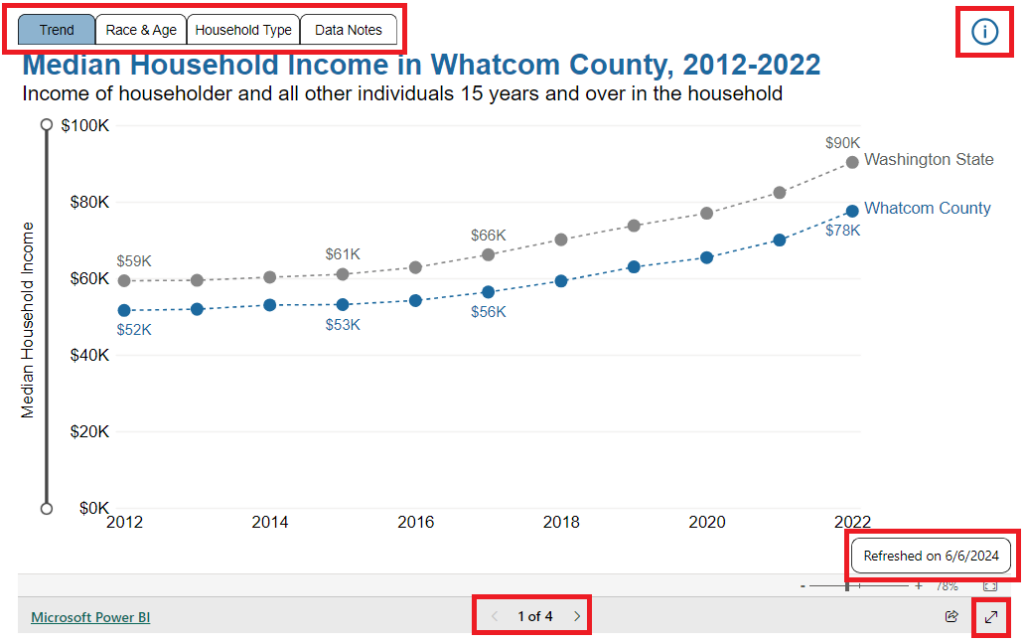
- Navigation tabs are located across the top of each dashboard. You can click on these and work your way through the data pages. At the bottom of the dashboard, you can also click through the pages using the “>” arrow.
- Click on the “i” icon, which will bring you to this navigation page.
- Make the report larger by clicking the icon in the bottom right corner.
- The refreshed by date indicates the last time the dashboard was updated.
- The Data Notes tab includes information on the data source, indicator definition, analysis years, and any other pertinent information.
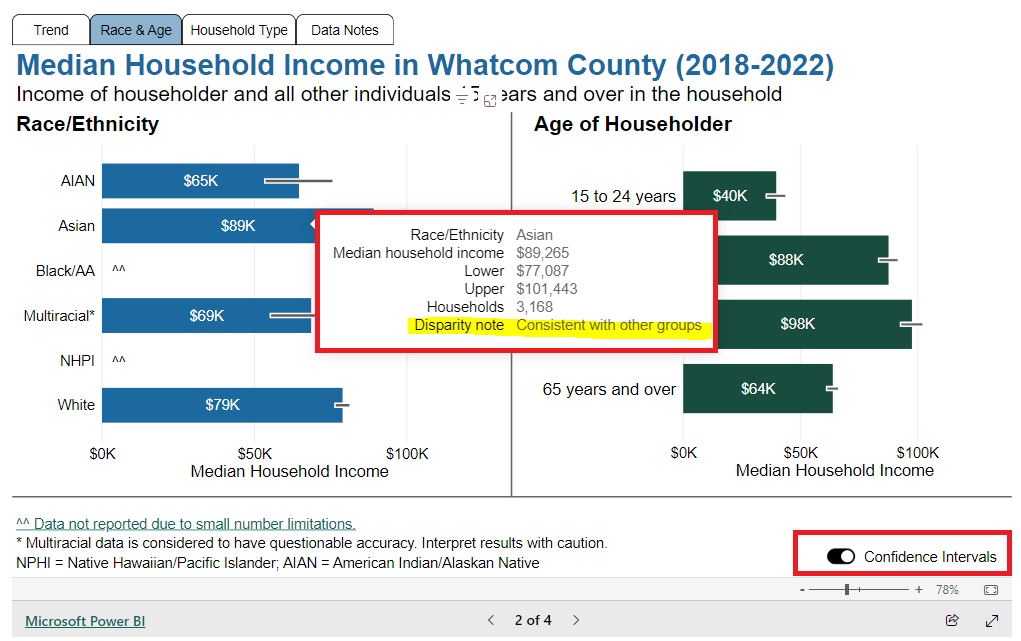
For each dashboard, you can hover your mouse over the bar or line chart, and a tooltip window containing more detailed information will appear. Tooltip windows for subpopulations will contain information on whether the data is statistically different from other groups in the analysis. This can be found next to Disparity Note. Dashboards include a confidence interval toggle that you can click to turn on and off for the visuals.
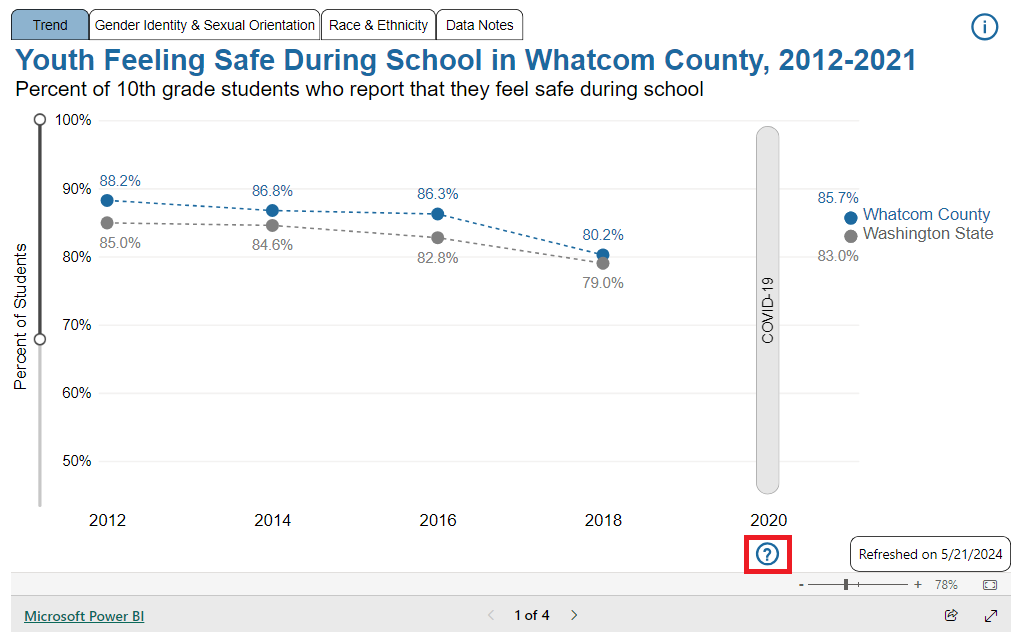
The dashboards for Healthy Youth Survey data will look like the one on the left. Hover over the “?” below the 2020 COVID-19 to learn more about how the HYS survey methodology impacted the data.
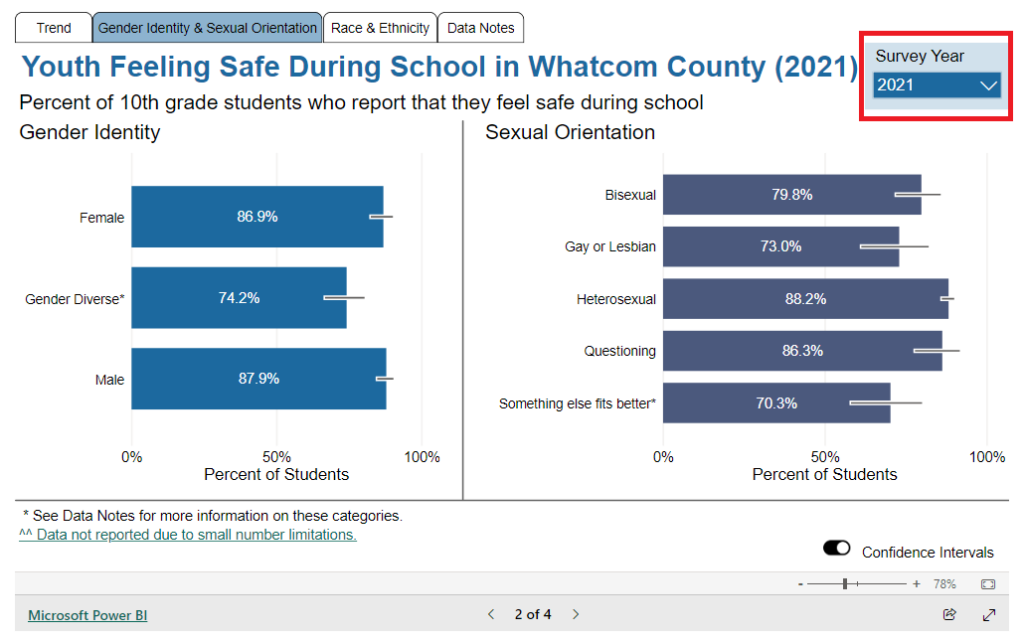
Reports using Healthy Youth Survey Data can also contain a date dropdown menu. For example, in the report on the left, you can view visuals for 2021 and the previous years by selecting the year(s) from the dropdown menu.
How to take a screenshot on the web

To take a screenshot using a Windows PC, use the Snipping Tool. To access the Snipping Tool, press the Windows key and start typing out “Snipping Tool,” which should appear for you to click on. Alternatively, press the Windows Logo + Shift + “S” on the keyboard to take a quick screenshot and then open the Snipping Tool application by clicking on the image thumbnail in the corner of your screen.
For taking a screenshot on a Mac computer, hit Shift + Command + “3” on your keyboard. It is similar to the Windows hotkey. You will see a thumbnail of the screenshot in the corner of your screen which you can then click on to edit.

